Welcome to Renewable Energy Nexus
Your comprehensive resource for understanding and implementing renewable energy solutions. Explore cutting-edge technologies, calculate potential savings, and discover global renewable projects.
Drag to rotate · click a part · click, then scroll to zoom
Turbine, site and live physics
4.2 MW geared · Ø 150 m rotor · 120 m hub- Wind now
- –
- with gusts
- Rotor speed
- –
- Generator
- –
- Power in wind
- –
- ½·ρ·A·v³
- Coefficient Cp
- –
- Betz limit 0.593
- Regulation
- –
- Capacity factor
- –
- Energy per year
- –
Show the physicsHide the physics
P = ½ · ρ · A · v³ · Cp · η · ρ = 1.225 kg/m³ · A = πR²
Yearly energy: power curve × Rayleigh wind distribution at hub height
How a Windrad makes electricity
Components
outside insideFrom rooftop sunshine to driving range
Follow the energy from photons striking the solar cells, through the inverter and home battery, all the way into an electric car. Change the time of day, the season and the clouds, and watch how a real 8.2 kWp system shares out its power.
Drag to rotate · click a part · click, then scroll to zoom
Live energy flow
8.2 kWp · 10 kWh battery · 11 kW wallbox- Home
- Car
- Battery
- Export
- Sun height
- –
- Irradiance
- –
- Solar output
- –
- AC from the inverter
- House load
- –
- typical profile
- Wallbox
- –
- Home battery
- –
- Grid
- –
- Car battery
- –
Show the physicsHide the physics
P = GPOA · A · ηmodule · ηinverter · PR
GPOA = DNI · cos θ + DHI · (1 + cos β) / 2 · β = 35°, latitude 50° N
How sunlight becomes driving range
Components
outside insideSplitting water with wind and sunshine
A wind farm and a solar park power a 10 MW PEM electrolyser that splits water into hydrogen and oxygen. Explore the plant from the turbines to the 300-bar storage, look inside a single cell, and see how much hydrogen the weather can make.
Drag to rotate · click a part · click, then scroll to zoom
Live plant model
12.6 MW wind · 10 MWp solar · 10 MW PEM electrolyser- Hydrogen (LHV)
- Stack heat
- Rectifier & plant
- Export
- Wind farm
- –
- Solar park
- –
- Electrolyser
- –
- Cell voltage
- –
- Hydrogen
- –
- Efficiency
- –
- Water
- –
- Storage
- –
Show the physicsHide the physics
ṁH₂ = N · I · ηF / (2F) · MH₂ (Faraday, F = 96,485 C/mol)
Ucell = 1.45 V + 0.25 V·cm²/A · j · η = ṁ · 33.3 kWh/kg / Pin
From wind and sun to hydrogen
Components
outside insidePower from mountain rivers, and its price
Follow a glacier-fed river through a weir, a tunnel inside the mountain and a 350 m penstock to the turbines. Then switch to Risks to see why the young, quake-prone Himalaya makes hydropower dangerous, and what diverting a river does to its fish, its banks and the people who live beside it.
Drag to rotate · click a part · click, then scroll to zoom
Live river and plant model
90 MW run-of-river · 350 m head · 3 Francis units- Through the turbines
- Environmental flow
- Spilled over the weir
- River inflow
- –
- Turbine flow
- –
- Power
- –
- Energy
- –
- Bypassed reach
- –
- Spill
- –
- Sediment
- –
- Flow swing
- –
Show the physicsHide the physics
P = ρ · g · Q · Hnet · ηturbine · ηgenerator
Hnet = 350 m − 18 m · (Q / 30 m³/s)² · units stop above 5 kg/m³ of sediment
From glacier to grid
Components
outside insideWhy the Himalaya is a risky place for hydropower
Dangers to the plant
Harm to the river and its people
Solar Power
Explore the latest advancements in photovoltaic technology and solar farm implementations.
Learn More →Wind Energy
Discover how modern wind turbines are revolutionizing clean energy production.
Learn More →Savings Calculator German market · 2026
- Rooftop solar: €1,100–€1,600/kWp installed
- Small wind: €2,400–€3,400/kW installed
- Battery storage: €500–€800/kWh
- Household electricity: €0.32–€0.38/kWh (€0.34 used)
- Feed-in tariff: ≈ €0.08/kWh surplus
- Grid CO₂ factor: 0.38 kg CO₂/kWh
*Estimates based on German renewable energy market conditions. View data sources
Understanding Renewable Energy
Learn about the different types of clean energy sources that are powering our future
Solar Energy
Technical Overview
Solar photovoltaic (PV) technology converts sunlight directly into electricity through the photovoltaic effect. When photons strike semiconductor materials (typically silicon), they excite electrons, creating an electrical current. This process occurs in solar cells, which are connected to form modules (panels), and multiple modules create arrays capable of generating utility-scale power.
Key Technologies:
- Monocrystalline Silicon: 20-22% efficiency, premium performance, black aesthetic
- Polycrystalline Silicon: 15-17% efficiency, cost-effective for large installations
- Thin-Film (CdTe, CIGS): 12-14% efficiency, flexible applications, lower material costs
- Bifacial Panels: Capture reflected light from both sides, 10-20% additional yield
- Concentrated Solar Power (CSP): Uses mirrors to concentrate sunlight, includes thermal storage
Current Industry Trends
- Perovskite Tandem Cells: Laboratory efficiencies exceeding 33%, commercial deployment expected 2026-2027
- Bifacial Technology Adoption: Now represents 40% of global module production
- Building-Integrated PV (BIPV): Solar roof tiles, facades, and transparent windows for urban applications
- Agrivoltaics: Combining agriculture with solar panels, optimizing land use while maintaining crop yields
- AI-Powered Optimization: Machine learning for predictive maintenance and energy yield forecasting
- Recycling Infrastructure: Emerging circular economy for panel end-of-life management (25-30 year lifespan)
Notable Global Projects
🌞 Bhadla Solar Park, India
Location: Rajasthan, India
Capacity: 2,245 MW (world's largest operational solar park)
Timeline: 2015-2020
Key Partners: Solar Energy Corporation of India (SECI), Adani Green Energy, Azure Power, Acme Solar
Impact: Powers 1.3 million homes, avoids 3.8 million tons of CO₂ annually, created 10,000+ jobs during construction
🌞 Noor-Ouarzazate Complex, Morocco
Location: Ouarzazate, Morocco
Capacity: 580 MW (world's largest CSP plant with thermal storage)
Timeline: 2013-2018
Key Partners: Moroccan Agency for Sustainable Energy (MASEN), World Bank, African Development Bank, European Investment Bank
Impact: 7.5-hour thermal storage enables evening power generation, reduces CO₂ by 760,000 tons/year, supports Morocco's 52% renewable energy target by 2030
🌞 Tengger Desert Solar Park, China
Location: Ningxia Province, China
Capacity: 1,547 MW
Timeline: 2012-2017
Key Partners: State Power Investment Corporation, China National Complete Plant Import & Export Corporation
Impact: Covers 43 km², equivalent to area of Monaco, demonstrates utility-scale solar viability in arid regions
🌞 Desert Sunlight Solar Farm, USA
Location: California, United States
Capacity: 550 MW (thin-film CdTe technology)
Timeline: 2011-2015
Key Partners: First Solar, NextEra Energy Resources, GE Energy Financial Services, Sumitomo Corporation
Impact: Powers 160,000 homes, offset 300,000 tons CO₂ annually, created 400 permanent jobs
Key Applications
- Utility-Scale Solar Farms: Grid-connected installations (50+ MW)
- Distributed Rooftop Systems: Residential and commercial installations (2-500 kW)
- Off-Grid Solutions: Remote communities, telecommunications, water pumping
- Floating Solar (Floatovoltaics): Reservoirs and water bodies, reduces evaporation
- Solar-Powered Transportation: EV charging infrastructure, solar roads
Wind Energy
Technical Overview & Operational Principles
Wind turbines operate on aerodynamic principles, converting kinetic energy from moving air into rotational mechanical energy, which drives an electrical generator. Modern horizontal-axis wind turbines (HAWTs) feature three blades optimized for maximum energy capture at varying wind speeds, with sophisticated control systems that adjust blade pitch and yaw orientation for optimal performance.
Core Components:
- Rotor & Blades: Aerodynamic surfaces (40-120m diameter) designed using advanced composites (fiberglass, carbon fiber)
- Nacelle: Houses gearbox, generator, control systems, and cooling equipment
- Tower: Steel or concrete structures (80-180m height) optimized for wind resource access
- Foundation: Engineered for local soil conditions, offshore turbines use monopiles, jackets, or floating platforms
- Power Electronics: Inverters, transformers, and SCADA systems for grid integration
Turbine Technologies
- Onshore Turbines: 2-6 MW capacity, 80-120m hub heights, capacity factors 30-45%
- Offshore Fixed-Bottom: 8-15 MW capacity, 100-150m hub heights, capacity factors 45-55%
- Floating Offshore: 10-15 MW capacity, accessing deep water sites (>60m depth), semi-submersible or spar platforms
- Direct-Drive vs. Geared: Direct-drive eliminates gearbox, reducing maintenance; geared systems offer higher torque multiplication
Current Industry Trends & Innovations
- Turbine Upscaling: Commercial 15+ MW turbines (Vestas V236-15.0, GE Haliade-X 14 MW), rotor diameters exceeding 220m
- Longer Blades: 115m+ blades using advanced materials, swept areas exceeding 40,000 m²
- Higher Hub Heights: Accessing stronger, more consistent winds; onshore turbines now reaching 150m+
- Digitalization: AI-powered predictive maintenance, digital twins, LiDAR-based wind forecasting
- Blade Recycling: Chemical recycling processes to recover composite materials, addressing end-of-life challenges
- Hybrid Systems: Wind-solar-battery combinations for improved capacity factors and grid stability
- Offshore Wind-to-Hydrogen: Direct electrolysis at offshore platforms for green hydrogen production
Notable Global Projects
🌬️ Hornsea 2 Offshore Wind Farm, UK
Location: North Sea, 89 km off Yorkshire coast, United Kingdom
Capacity: 1,320 MW (world's largest operational offshore wind farm)
Timeline: 2016-2022
Key Partners: Ørsted (developer), Siemens Gamesa (turbine supplier, 165× 8 MW turbines), Global Marine Group (cable installation)
Impact: Powers 1.4 million UK homes, avoids 2.5 million tons CO₂ annually, 462 km² area, created 2,000+ jobs during construction
🌬️ Gansu Wind Farm Project, China
Location: Gansu Province, China (Gobi Desert region)
Capacity: 8,000 MW planned (phased development, 6,000+ MW operational)
Timeline: 2009-ongoing
Key Partners: China Longyuan Power Group, China Datang Corporation, Guohua Energy Investment
Impact: Part of China's "wind power bases" strategy, demonstrates large-scale onshore deployment, transmission challenges addressed via HVDC lines
🌬️ Hywind Tampen, Norway
Location: Norwegian North Sea (140 km offshore)
Capacity: 88 MW (world's largest floating offshore wind farm)
Timeline: 2019-2022
Key Partners: Equinor (operator), Siemens Gamesa (11× 8 MW turbines), Kværner (platform fabrication)
Impact: Powers Snorre and Gullfaks oil/gas platforms, reducing offshore operations emissions by 200,000 tons CO₂/year, proves floating technology viability at scale
🌬️ Alta Wind Energy Center, USA
Location: Tehachapi Mountains, California, United States
Capacity: 1,548 MW (largest onshore wind farm in USA)
Timeline: 2010-2013
Key Partners: Terra-Gen (operator), GE Renewable Energy, Mitsubishi Heavy Industries
Impact: Powers 450,000 homes, 600 turbines across 3,200 hectares, long-term PPAs with Southern California Edison
Deployment Strategies
- Wind Resource Assessment: Multi-year LiDAR campaigns, mesoscale modeling, capacity factor optimization
- Hybrid Interconnection: Co-locating wind with solar/storage to maximize transmission utilization
- Repowering: Replacing older turbines with modern units, 2-3× capacity increases on same land
- Community Benefit Models: Revenue sharing, local ownership stakes, economic development agreements
- Environmental Mitigation: Avian radar systems, seasonal curtailment protocols, marine mammal monitoring
Hydropower
Technical Overview
Hydropower harnesses the potential and kinetic energy of water to generate electricity. As water flows from higher to lower elevations, it spins turbines connected to generators. This technology represents the world's oldest and most mature renewable energy source, providing approximately 16% of global electricity and offering crucial grid flexibility through rapid response capabilities.
Types of Hydropower Systems
- Conventional Impoundment Dams: Large reservoirs store water for controlled release, providing dispatchable power and flood control. Capacity: 100+ MW, head heights 50-300m
- Run-of-River (RoR): Minimal or no reservoir, diverts portion of river flow through turbines. Lower environmental impact, limited storage. Capacity: 1-100 MW
- Pumped Storage Hydropower (PSH): Two reservoirs at different elevations; pumps water uphill during low-demand periods, releases during peak demand. Acts as massive battery. Efficiency: 70-85%
- Tidal Power: Harnesses ocean tides using barrages or tidal stream generators. Predictable but geographically limited
- Micro/Mini Hydro: Small-scale installations (<10 MW) for local communities, minimal environmental disruption
Generation Methods & Components
- Turbine Types:
- Francis Turbines: Most common, medium head (40-600m), 90%+ efficiency
- Kaplan Turbines: Low head (<40m), adjustable blades, ideal for RoR
- Pelton Wheels: High head (>300m), impulse-type, mountain installations
- Bulb Turbines: Horizontal axis, tidal and low-head applications
- Penstock: Pressurized pipeline delivering water to turbines, optimized for head and flow rate
- Spillways: Safety structures for excess water discharge during floods
- Fish Passage Systems: Ladders, lifts, or bypass channels to maintain aquatic ecosystem connectivity
Current Industry Trends
- Modernization & Digitalization: Retrofitting aging infrastructure with digital sensors, predictive analytics for maintenance optimization
- Variable Speed Technology: Frequency converters enable wider operating range, improved efficiency at partial loads
- Hybrid Hydro-Solar-Wind: Complementary generation patterns maximize infrastructure utilization
- Environmental Flow Management: Advanced monitoring and release schedules to balance energy production with ecosystem health
- Pumped Storage Expansion: Critical for integrating intermittent renewables, new closed-loop systems minimize environmental impact
- Small Modular Hydro: Standardized, pre-fabricated units for rapid deployment in remote areas
Notable Global Projects
💧 Three Gorges Dam, China
Location: Yangtze River, Hubei Province, China
Capacity: 22,500 MW (world's largest hydroelectric power station by installed capacity)
Timeline: 1994-2012 (18 years construction)
Key Partners: China Yangtze Power (operator), China Three Gorges Corporation, 32× 700 MW Francis turbines + 2× 50 MW generators
Impact: Annual generation 100+ TWh, flood control for 15 million people, 600 km reservoir, controversial displacement of 1.3 million residents, navigation improvements for Yangtze shipping
💧 Itaipu Dam, Brazil/Paraguay
Location: Paraná River, Brazil-Paraguay border
Capacity: 14,000 MW (20× 700 MW Francis turbines)
Timeline: 1975-1984
Key Partners: Itaipu Binacional (bi-national entity), Alstom/Voith (turbine suppliers)
Impact: Supplies 15% of Brazil's electricity, 90% of Paraguay's; record annual generation 103.1 TWh (2016); binational cooperation model
💧 Bath County Pumped Storage Station, USA
Location: Virginia, United States
Capacity: 3,003 MW (world's largest pumped storage facility by capacity)
Timeline: 1977-1985
Key Partners: Dominion Energy (operator), 6× 500 MW reversible Francis turbines
Impact: Provides grid stability for Mid-Atlantic region, 11-hour full-load generation capacity, supports renewable integration, 8-hour pump-back time
💧 Nant de Drance, Switzerland
Location: Swiss Alps, Valais Canton
Capacity: 900 MW pumped storage (6× 150 MW reversible Francis turbines)
Timeline: 2008-2022 (14 years construction)
Key Partners: Alpiq, SBB, IWB, FMV; Alstom/GE (turbines), 17 km underground tunnels
Impact: Balances Swiss and European grids, 20-hour generation capacity, exemplary engineering in complex alpine geology
💧 Belo Monte Dam, Brazil
Location: Xingu River, Pará State, Brazil
Capacity: 11,233 MW (world's 4th largest)
Timeline: 2011-2019
Key Partners: Norte Energia (consortium), Andritz Hydro, Alstom, Voith
Impact: Run-of-river design minimizes reservoir area, supplies 11% of Brazil's electricity, controversial indigenous displacement, seasonal flow variation challenges
Environmental Considerations
- Positive Impacts: Zero direct emissions, flood control, water supply regulation, recreation opportunities, long operational life (50-100+ years)
- Challenges:
- Ecosystem Disruption: Altered river flow regimes, sediment trapping, temperature changes
- Fish Migration: Barriers to spawning routes, addressed through fish ladders and turbine designs
- Methane Emissions: Decomposition of organic matter in tropical reservoirs can release CH₄
- Land Use: Large reservoirs may inundate forests, agricultural land, or communities
- Mitigation Strategies: Environmental flow requirements, sediment bypass systems, habitat restoration, community relocation programs with fair compensation
Future Outlook
Hydropower's role is evolving from baseload generation to flexible grid support, enabling higher penetration of variable renewables. Pumped storage capacity is projected to double by 2050, while run-of-river and modernization projects focus on sustainable development aligned with ecosystem preservation.
Green Hydrogen
Technical Overview
Green hydrogen is produced through water electrolysis powered exclusively by renewable electricity (solar, wind, hydro), splitting H₂O molecules into hydrogen and oxygen with zero carbon emissions. Unlike gray hydrogen (derived from natural gas via steam methane reforming, emitting 9-12 kg CO₂/kg H₂) or blue hydrogen (with carbon capture), green hydrogen offers a truly sustainable energy carrier for decarbonizing sectors where direct electrification is impractical.
Production Processes
- Alkaline Electrolysis (AEL):
- Mature technology (100+ years), uses liquid KOH or NaOH electrolyte
- Efficiency: 60-70%, operating pressure: 1-30 bar, operating temperature: 60-80°C
- Large-scale systems: 1-5 MW modules, scalable to 100+ MW
- Advantages: Proven reliability, no precious metals, long lifetime (60,000-90,000 hours)
- Manufacturers: NEL Hydrogen, McPhy, Tianjin Mainland
- Proton Exchange Membrane (PEM) Electrolysis:
- Uses solid polymer electrolyte, rapid response to variable renewable input
- Efficiency: 65-75%, operating pressure: 30-80 bar, compact design
- Advantages: High current density, dynamic operation (10-110% load range), pure hydrogen output (99.999%)
- Challenges: Requires platinum-group metals (iridium, platinum), higher capex
- Manufacturers: Siemens Energy, ITM Power, Plug Power
- Solid Oxide Electrolysis Cells (SOEC):
- High-temperature electrolysis (700-900°C), uses ceramic electrolyte
- Efficiency: 80-90% (electrical + thermal energy), reversible fuel cell operation
- Development stage: Pilot/demonstration projects, commercial scale by 2025-2030
- Ideal for industrial waste heat integration
- Leaders: Haldor Topsoe, Sunfire, Bloom Energy
- Anion Exchange Membrane (AEM):
- Emerging technology combining AEL and PEM advantages
- No precious metals required, alkaline chemistry with solid membrane
- Current status: Lab/pilot scale, targeting commercial deployment 2026-2028
Storage Solutions
- Compressed Gas Storage: 350-700 bar pressure vessels, most common for transport applications, energy density 0.5-1.3 kWh/L
- Liquid Hydrogen (LH₂): Cryogenic storage at -253°C, higher density (2.4 kWh/L), energy-intensive liquefaction (30% energy penalty), used for maritime/aerospace
- Underground Storage: Salt caverns (1,000+ bar), depleted gas fields, aquifers for seasonal/large-scale storage (TWh capacity)
- Metal Hydrides: Solid-state storage in metal alloys, safe but lower gravimetric density, R&D stage for automotive
- Liquid Organic Hydrogen Carriers (LOHC): Chemical bonding to organic molecules (e.g., toluene/methylcyclohexane), ambient pressure/temperature transport, dehydrogenation required at end-use
- Ammonia (NH₃): Hydrogen carrier via Haber-Bosch process, liquid at -33°C or 8 bar, existing infrastructure, cracking required for fuel cell use
Current Industry Trends
- Gigawatt-Scale Projects: Transition from MW pilots to GW electrolyzer deployments by 2025-2030
- Cost Reduction Trajectory: Green H₂ production costs falling from $5-6/kg (2020) to projected $1-2/kg by 2030 through scale and renewable energy cost declines
- Electrolyzer Manufacturing Scale-Up: Global capacity targets 100-200 GW/year by 2030 (vs. 10 GW/year in 2023)
- Offshore Wind-to-Hydrogen: Integrated offshore platforms combining wind turbines with electrolyzers, subsea H₂ pipelines
- Policy Support: EU REPowerEU (10 MT green H₂ by 2030), US Inflation Reduction Act ($3/kg production tax credit), national hydrogen strategies in 40+ countries
- Certification Schemes: Guarantees of Origin (GO), CertifHy standards ensuring <3.4 kg CO₂e/kg H₂ lifecycle emissions
- Co-Location with Industry: Direct connections to refineries, ammonia plants, steel mills to bypass distribution costs
Notable Global Projects
⚡ HyDeal España, Spain
Location: Castile and León, Spain
Capacity: 9.5 GW solar + 7.4 GW electrolyzers (world's largest green hydrogen project planned)
Timeline: 2025-2030
Key Partners: ArcelorMittal, Enagás, Grupo Fertiberia, DH2 Energy, solar developers consortium
Impact: Target production 330,000 tons H₂/year by 2030, decarbonize Spanish steel and fertilizer industries, €10 billion investment, aims for €1.50/kg production cost
⚡ NEOM Green Hydrogen Project, Saudi Arabia
Location: NEOM City, Tabuk Province, Saudi Arabia
Capacity: 4 GW solar+wind + 2.2 GW electrolyzer
Timeline: 2020-2026
Key Partners: ACWA Power, Air Products, NEOM (PIF), thyssenkrupp nucera (electrolyzers), Haldor Topsoe (ammonia synthesis)
Impact: 650 tons H₂/day → 1.2 MT ammonia/year for export, powers 20,000 hydrogen buses equivalent, $8.4 billion investment, will be world's largest upon completion
⚡ H2-Fifty, Netherlands
Location: Eemshaven, Groningen, Netherlands
Capacity: 50 MW PEM electrolyzer (operational 2024)
Timeline: 2021-2024
Key Partners: Gasunie, Vattenfall, Groningen Seaports, ITM Power (10 MW PEM modules)
Impact: 8,000 tons H₂/year, supplies northern Netherlands industry, demonstrates utility-scale PEM technology, paves way for 100+ GW European hydrogen backbone
⚡ HyStation, Japan
Location: Fukushima, Japan (Fukushima Hydrogen Energy Research Field)
Capacity: 20 MW solar + 10 MW electrolyzer
Timeline: 2018-2020
Key Partners: Toshiba Energy Systems, Tohoku Electric Power, NEDO (New Energy and Industrial Technology Development Organization)
Impact: 900 tons H₂/year, powered Tokyo 2020 Olympics torch and venues, largest green hydrogen facility in Japan, demonstration of demand-response electrolysis
⚡ Hy Stor Energy, USA
Location: Mississippi, United States (salt cavern storage)
Capacity: 1 GW solar + 600 MW electrolyzers + salt cavern storage
Timeline: 2024-2028
Key Partners: Hy Stor Energy, Mitsubishi Power Americas, private equity investors
Impact: First utility-scale green hydrogen hub in US, 60,000 tons H₂/year, demonstrates long-duration storage (weeks/months), targets industrial decarbonization along Gulf Coast
⚡ Asian Renewable Energy Hub, Australia
Location: Pilbara region, Western Australia
Capacity: 26 GW wind+solar + 14 GW electrolyzers
Timeline: 2028-2035 (phased)
Key Partners: InterContinental Energy, CWP Global, Vestas, bp (strategic partner)
Impact: 1.6 MT green hydrogen/year (or 9 MT ammonia), export to Asia (Japan, South Korea, Singapore), $36 billion project, world's largest renewable energy project
Emerging Use Cases
- Steel Production (Direct Reduced Iron): Replace coal/coke with H₂ in blast furnaces, HYBRIT (Sweden), H2 Green Steel, Thyssenkrupp trials
- Ammonia Synthesis: Green fertilizers replacing Haber-Bosch from natural gas, critical for food security
- Refining & Petrochemicals: Desulfurization, hydrocracking, methanol production from green H₂ + captured CO₂
- Heavy-Duty Transport:
- Long-Haul Trucking: Fuel cell trucks (Nikola, Hyundai XCIENT), 400+ km range
- Maritime Shipping: Ammonia/H₂ fuel cells for cargo vessels, Maersk net-zero 2040 target
- Aviation: Liquid H₂ for medium-haul flights (Airbus ZEROe concept), SAF via H₂-based e-fuels
- Rail: Hydrogen trains (Alstom Coradia iLint) for non-electrified routes
- Grid Balancing: Seasonal energy storage, converting summer solar surplus to winter heating/power via H₂
- Heating: Blending H₂ into natural gas networks (5-20%), dedicated H₂ grids for industrial zones
- E-Fuels: Synthetic methane, methanol, jet fuel via H₂ + CO₂ (power-to-X pathways)
Hydrogen Production Methods Comparison:
| Type | Production Method | CO₂ Emissions | Cost (2024) | Global Share |
|---|---|---|---|---|
| Gray | Steam methane reforming (SMR) | High (9-12 kg CO₂/kg H₂) | $1.0-2.5/kg | ~95% |
| Blue | SMR + Carbon Capture & Storage | Reduced (1-3 kg CO₂/kg H₂) | $2.0-3.5/kg | ~1% |
| Green | Electrolysis + Renewable Power | Zero (lifecycle <0.5 kg CO₂e/kg H₂) | $3.5-6.0/kg (falling to $1-2 by 2030) | ~4% |
| Turquoise | Methane pyrolysis → H₂ + solid carbon | Near-zero (if renewable heat used) | $2.5-4.0/kg (pilot stage) | <0.1% |
Challenges & Outlook
Current Barriers: High production costs (electrolyzer capex, renewable electricity prices), limited infrastructure (pipelines, refueling stations), energy losses in conversion chains (electrolysis 25-35%, liquefaction 30%, fuel cells 40-60%), regulatory fragmentation.
2030 Projections: Global green hydrogen production capacity reaching 25-40 MT/year (vs. 0.3 MT in 2023), electrolyzer costs declining 50-70%, emergence of transcontinental hydrogen trade (Middle East/Australia to Europe/Asia), grid parity with gray hydrogen in regions with abundant cheap renewables.
Role in Net-Zero: IEA estimates hydrogen must scale to 200+ MT/year by 2050 to meet 1.5°C pathways, representing 13% of final energy demand and critical for decarbonizing "hard-to-abate" sectors.
Global Projects
Interactive Project Map
Explore major renewable energy installations worldwide. Zoom and click on the markers for capacity details.
Renewable Energy Consultation
Get expert advice for your small-scale renewable energy projects
Featured Articles
Explore our in-depth articles on renewable energy technologies and sustainability
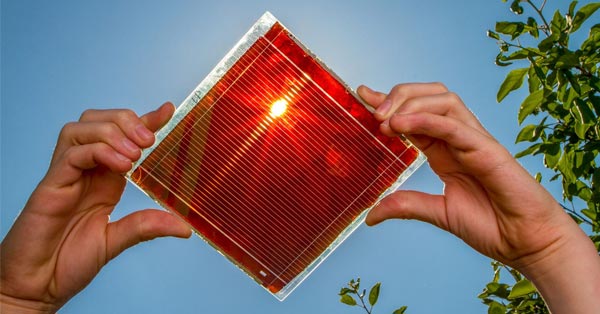
The Future of Solar Panel Efficiency: Perovskite Breakthroughs
Lab prototypes now hit over 33% conversion efficiency - nearly double what standard silicon panels can do.
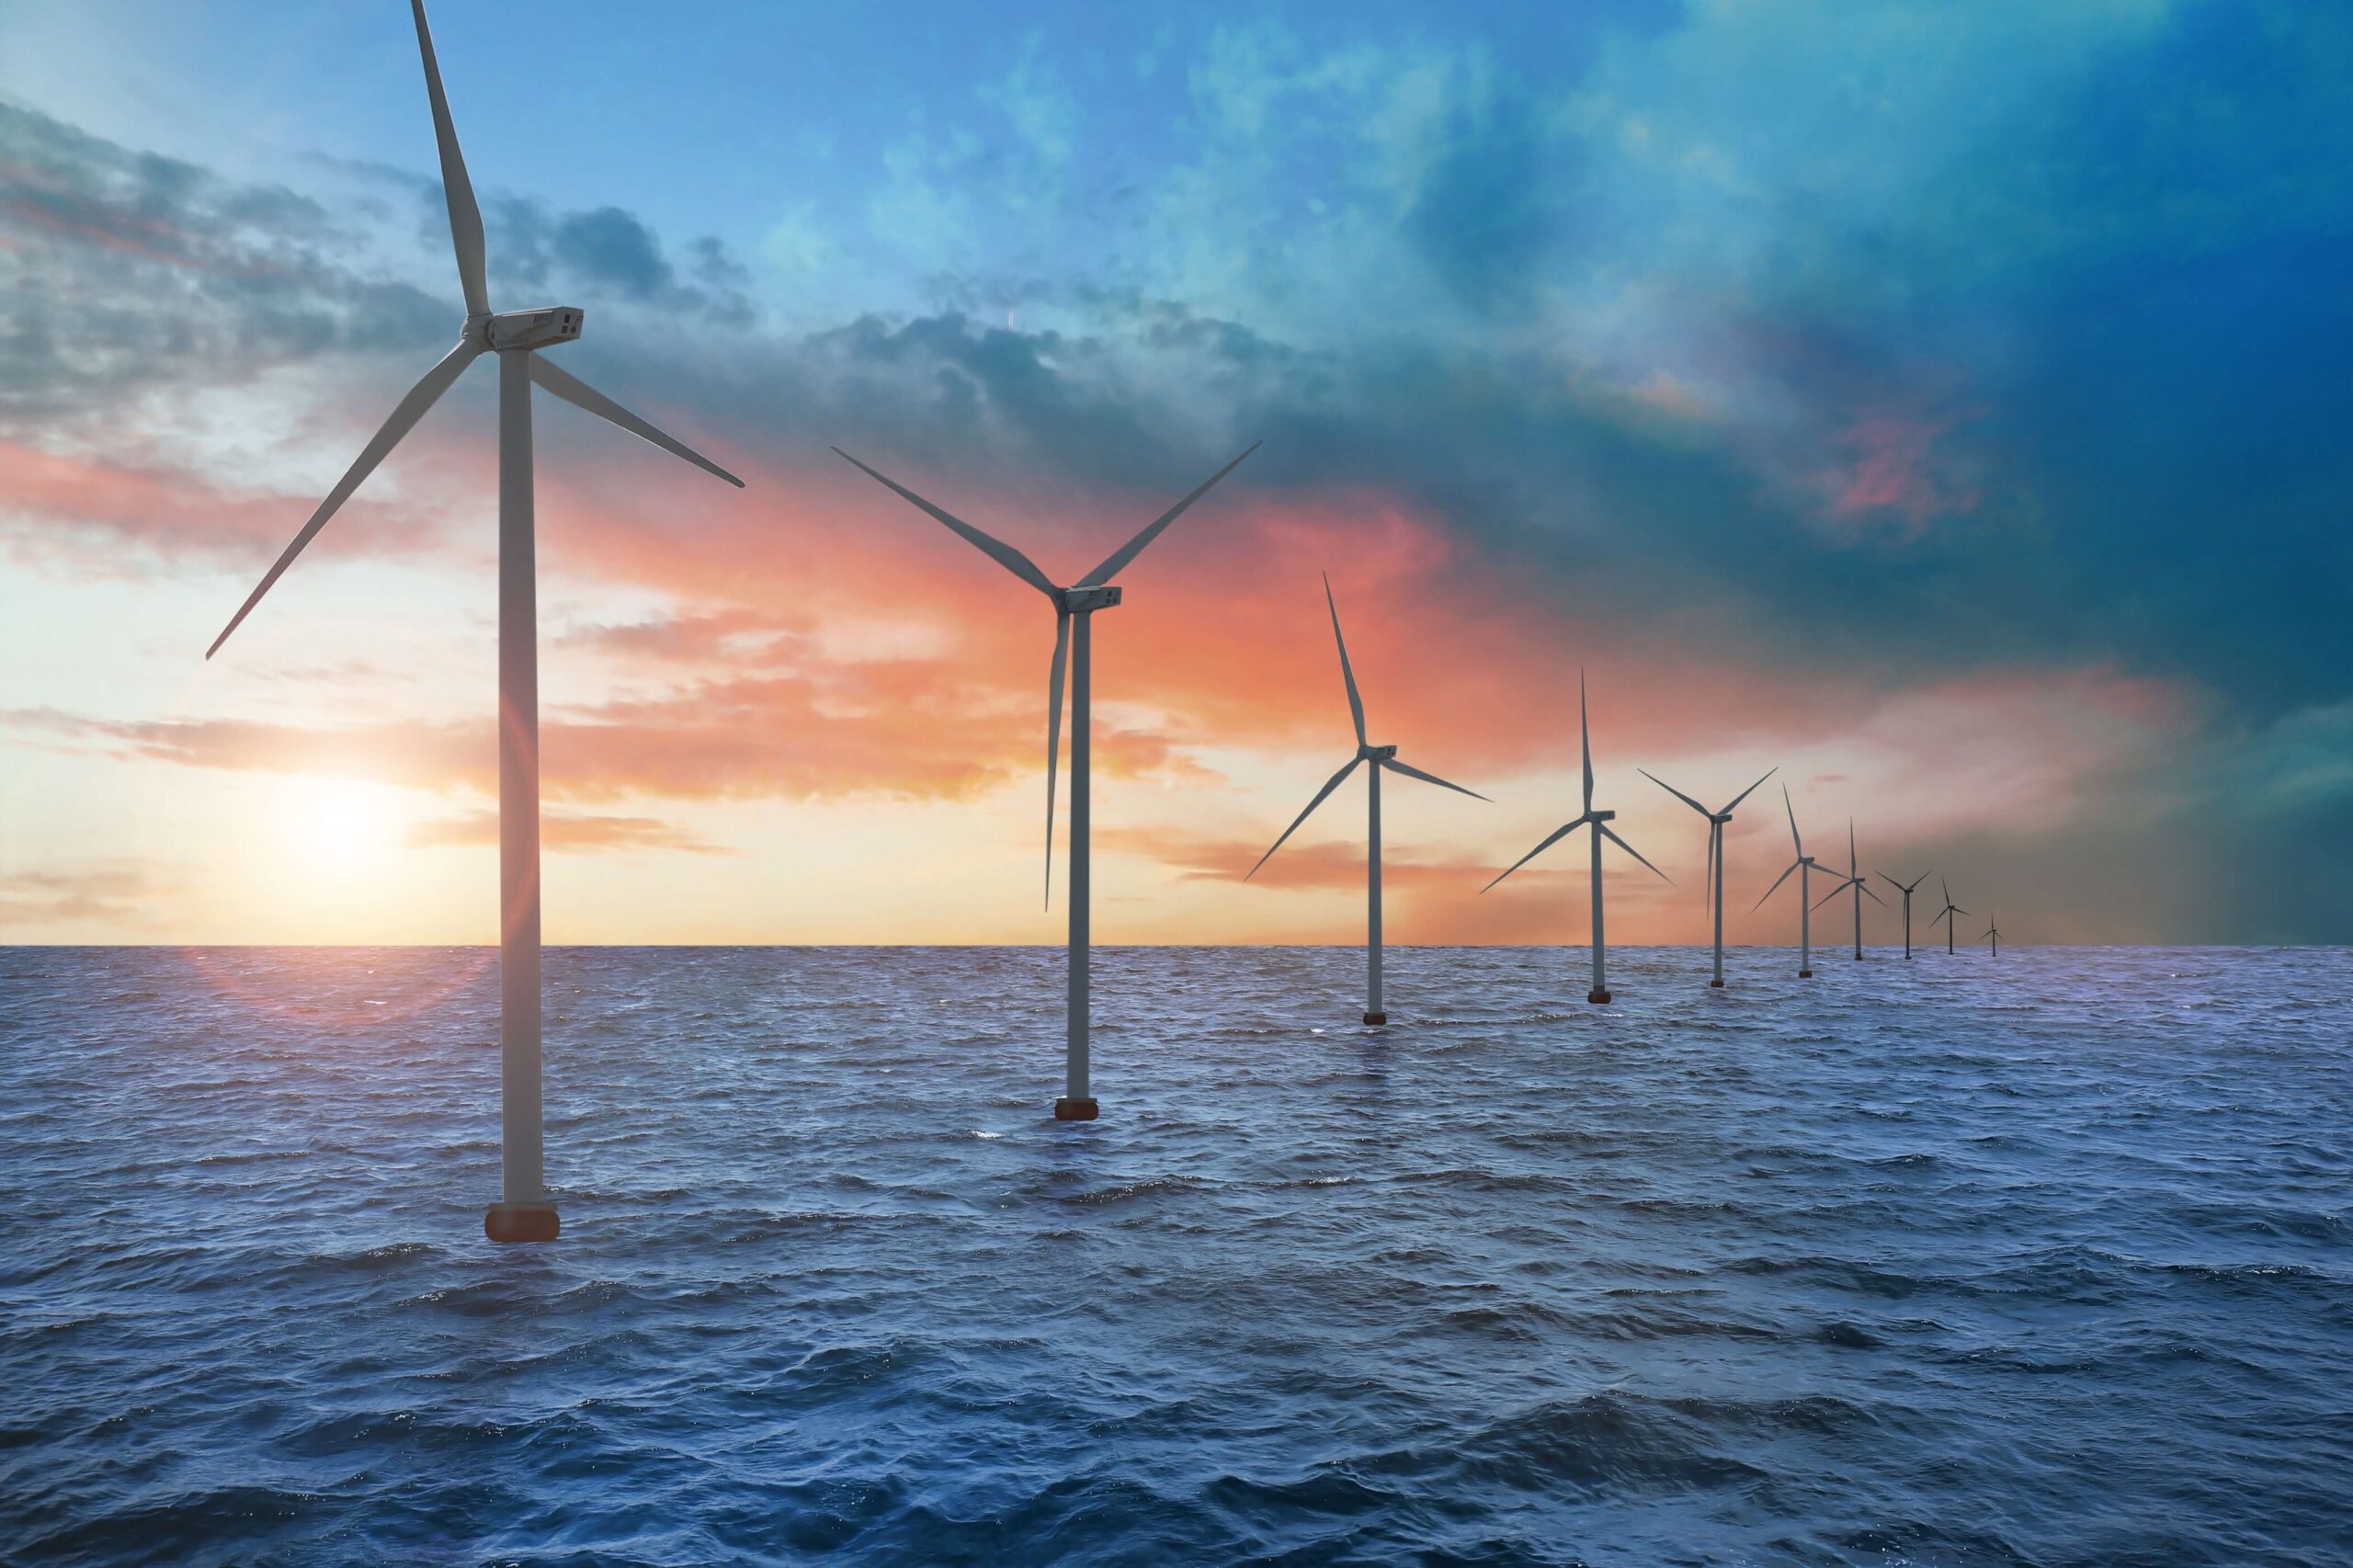
Offshore Wind Farms: Challenges and Opportunities
Floating offshore wind turbines are opening up deep-water locations for renewable energy generation.

Germany's Energy Ballet: Where Electrons Waltz and Batteries Pirouette
How battery storage and demand-side management are choreographing the future of renewable grids.

Cold Feet, Warm Hearts: Why We Don't Do What We Know
The science behind the attitude-behaviour gap and how to bridge it for sustainable living.